Documentation Index
Fetch the complete documentation index at: https://docs.yourhomie.ai/llms.txt
Use this file to discover all available pages before exploring further.
Usage is tracked in real‑time across all assistants. Charts update instantly after every message.
Dashboard overview
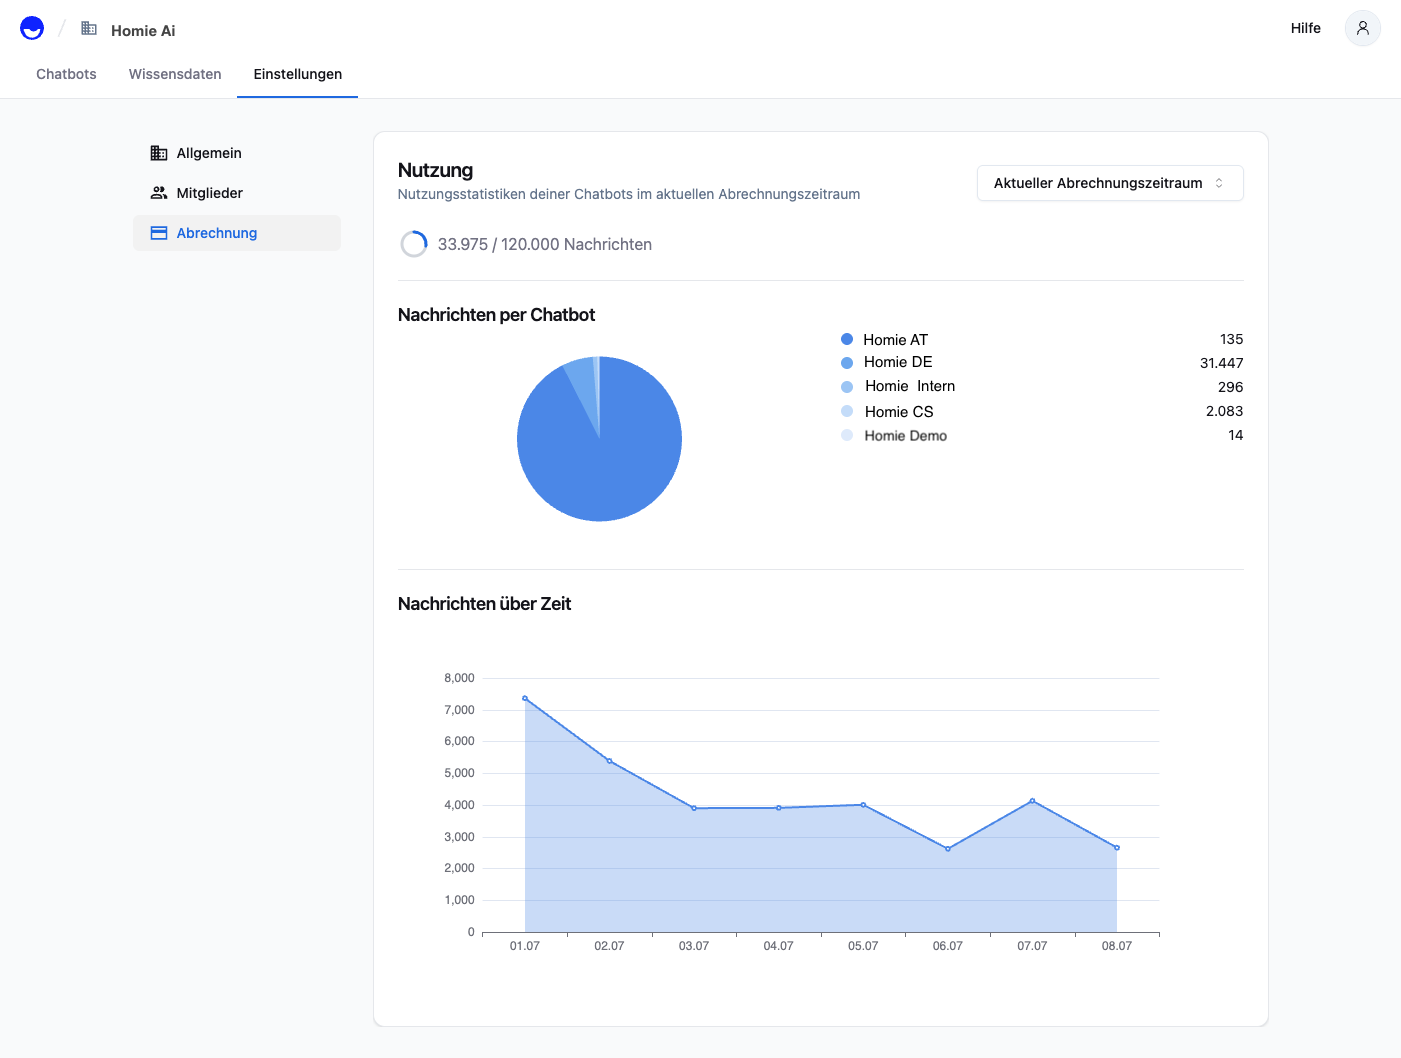
- Progress ring – credits used vs. plan limit for the selected period.
- Pie chart “Messages per assistant” – shows the share each bot consumes.
- Area chart “Messages over time” – daily volume trend.
Time range
A dropdown in the top‑right corner lets you adjust the time range: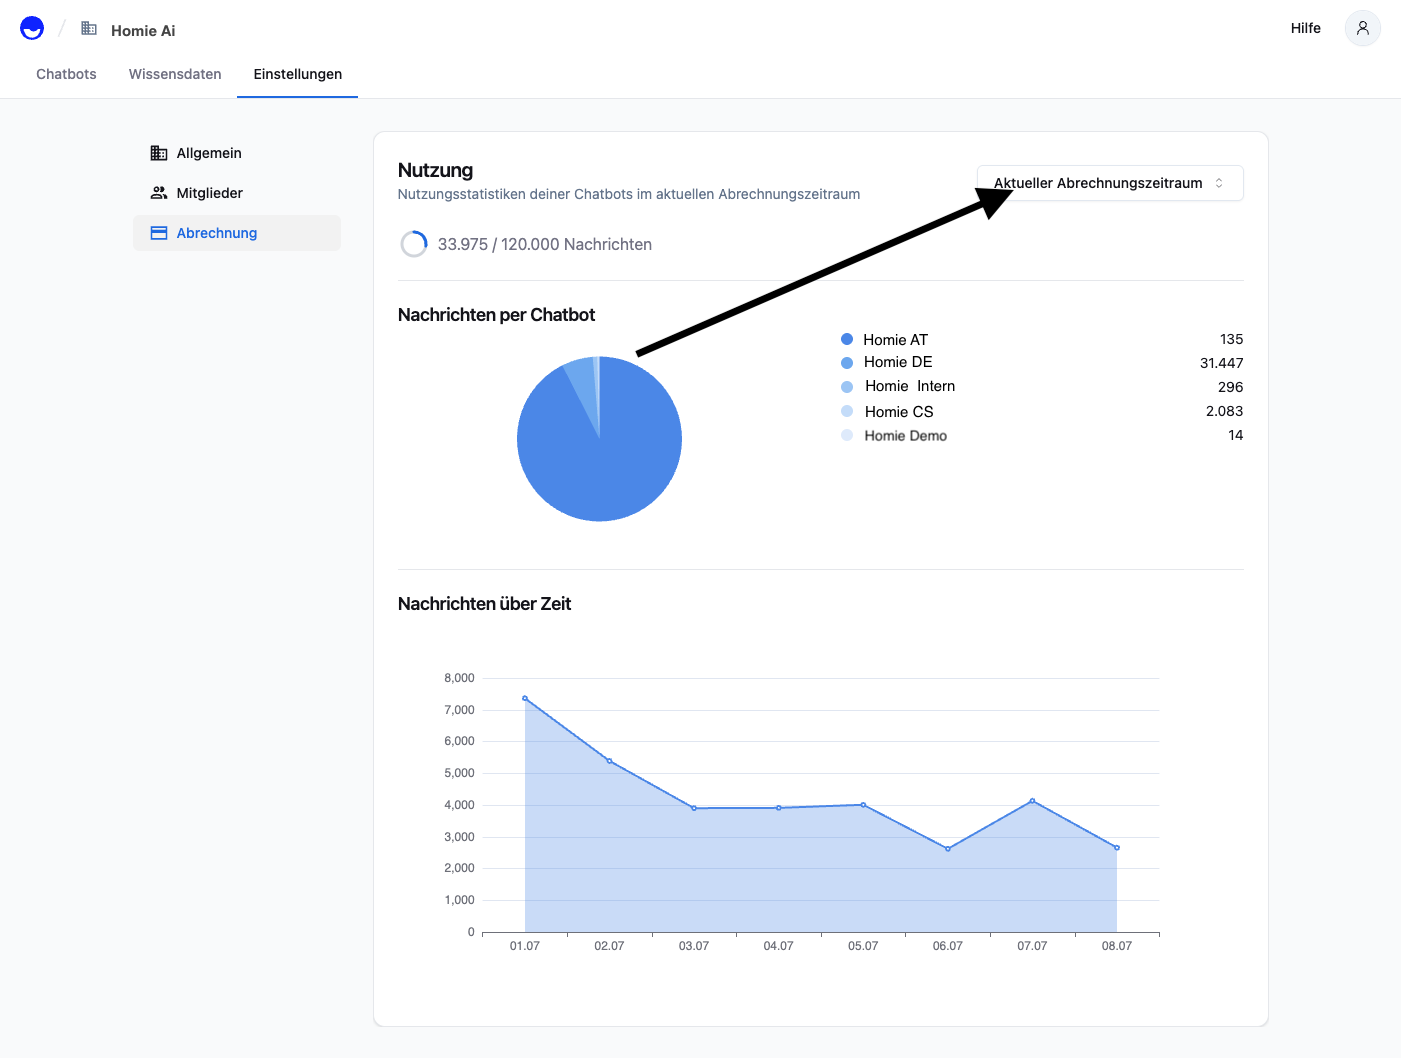
| Option | What it shows |
|---|---|
| Current billing period | Default view – tracks credits against your plan limit. |
| Yesterday / Last 7 days / Last 30 days | Quick looks at recent traffic. |
| Custom | Pick any start & end date for ad‑hoc analysis. |